

Calculating Scope 1 and Scope 2 emissions is often relatively straightforward. Companies usually have access to their fuel consumption, electricity bills, and other operational data.
Scope 3 is different.
The emissions occur across the value chain: in purchased materials, transportation, business travel, waste, capital goods, product use, end-of-life treatment, and many other activities outside the company's direct operations.
And the biggest challenge is often not the calculation itself.
It is getting the data.
Many companies delay calculating Scope 3 because they believe they first need detailed information from every supplier.
They don't.
A Scope 3 inventory can start with the data already available today and become more specific over time.
The journey often looks something like this:
The goal is not to make every datapoint perfect from day one.
The goal is to calculate, identify the important emission sources, and progressively improve the data behind them.
Start with what you have
Imagine a company purchasing hundreds or thousands of different materials, products, and services every year.
Ideally, it would know the carbon footprint associated with every purchase.
In reality, procurement systems may initially contain only:
- supplier name,
- purchase category,
- invoice value,
- quantity,
- material description,
- country,
- and purchase date.
Some suppliers may already provide detailed product carbon footprints.
Others may provide only basic product information.
And many may provide no carbon data at all.
This does not mean the company cannot calculate Scope 3.
Different calculation methods can be used depending on the quality and availability of data.
Rather than waiting until the best possible data exists, companies can begin with estimates and improve their calculations as better information becomes available.
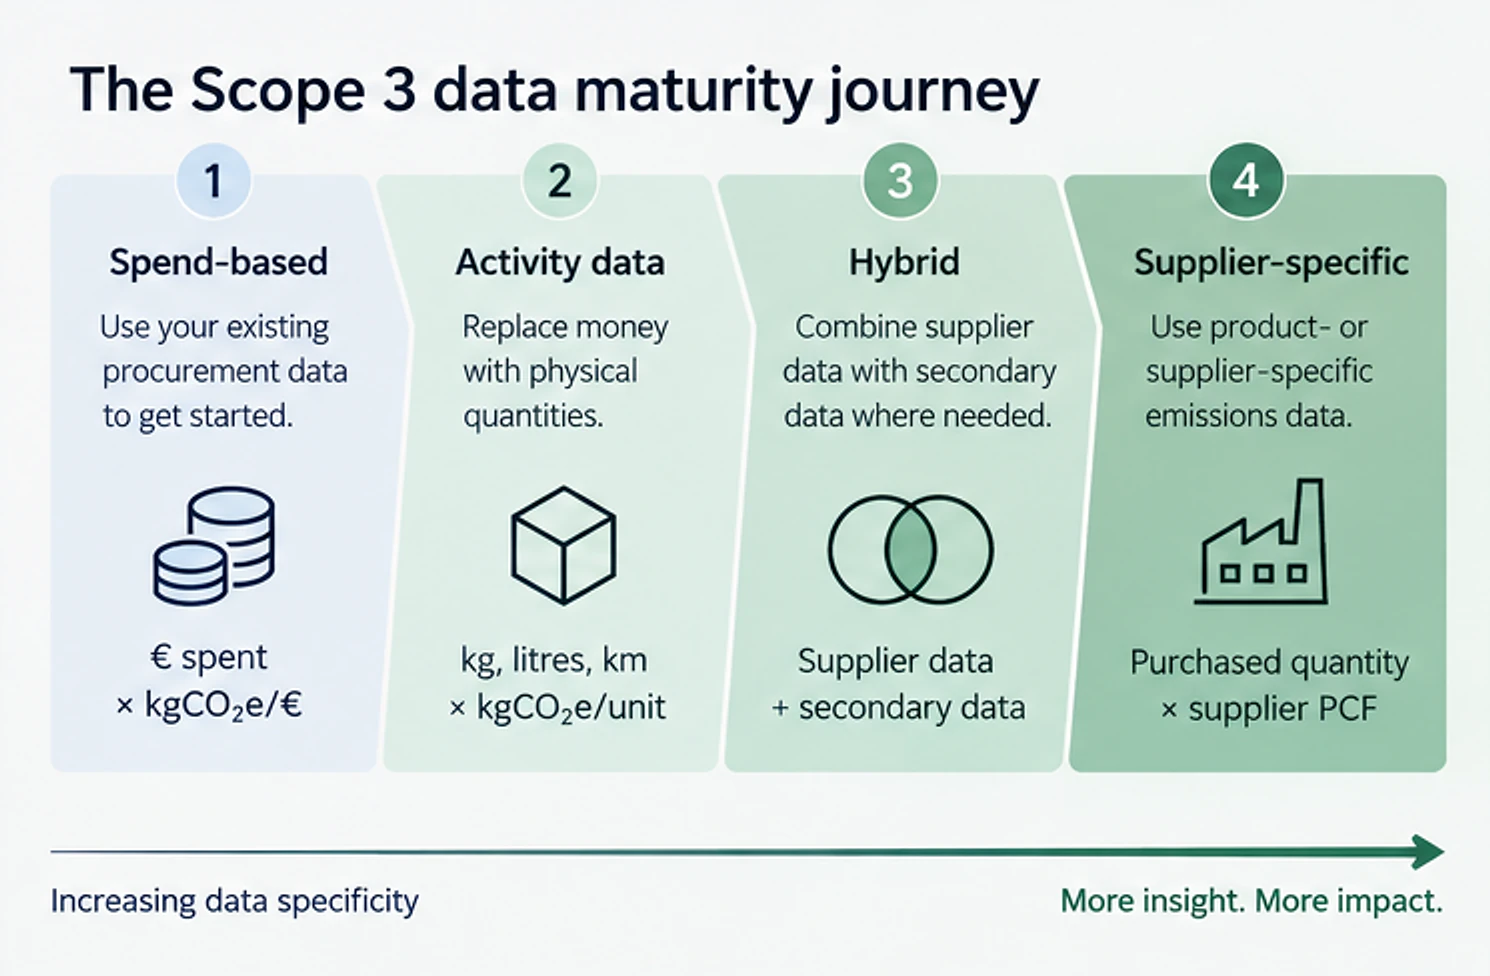
Level 1: Spend-based estimates
For many companies, spend data is the easiest Scope 3 data to access.
Accounting and procurement systems already record how much was spent on materials, products, and services.
A spend-based calculation generally follows a simple formula:
Amount spent × Emission factor per monetary unit = Emissions
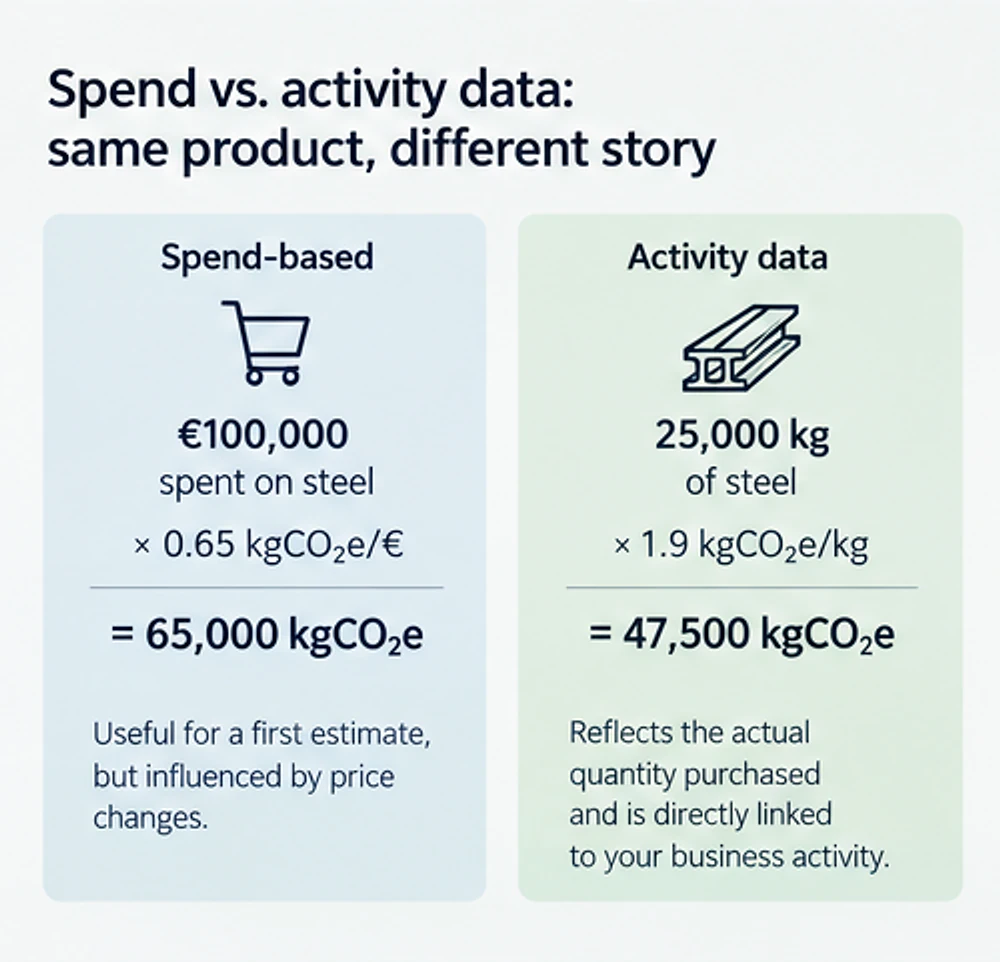
For example:
The emission factors typically come from environmentally extended input-output, or EEIO, databases that connect economic activity in different sectors with greenhouse gas emissions.
Instead of needing to know how many kilograms of every material were purchased, a company can use information it already has in its accounting system to create an initial estimate of its Scope 3 emissions.
From accounting data to Scope 3 in Verde365
This is also one of the easiest ways to get started in Verde365.
Companies can simply export their invoices from their accounting software and upload them to Verde365.
Verde365 can then use the purchasing data from those invoices together with EEIO emission factors to calculate spend-based Scope 3 estimates.
Instead of manually processing hundreds or thousands of transactions, companies can turn existing accounting data into an initial Scope 3 footprint in seconds.
The workflow can be as simple as:
This means companies do not need to wait for detailed supplier carbon data before understanding where their largest value-chain emissions may be.
Their existing invoices can become the starting point.
Why spend-based data is useful
Spend-based calculations can be extremely useful for creating an initial Scope 3 inventory.
They are particularly suitable when a company has:
- good accounting data,
- hundreds or thousands of invoices,
- many suppliers or purchasing transactions,
- limited information about physical quantities,
- little supplier-specific carbon data,
- or is calculating Scope 3 for the first time.
Instead of spending months collecting detailed information before calculating anything, the company can use existing procurement and accounting data to create an initial picture of its value-chain emissions.
That first picture can reveal something very important:
Where are the biggest potential Scope 3 hotspots?
And that is where spend-based calculations become especially valuable.
They do not need to be the final destination.
They can be the starting point for deciding where better data is actually needed.
But spend is not the same as physical activity
Spend-based calculations also have limitations.
Suppose the price of steel increases significantly from one year to the next.
The company purchases exactly the same quantity of steel, from exactly the same supplier, produced in exactly the same way.
But its expenditure increases.
A purely spend-based calculation could therefore show higher emissions even though the physical activity itself did not change.
The reverse could also happen.
Prices could decrease while physical consumption remains unchanged.
This is why spend-based results are often particularly useful for screening and prioritisation, while physical activity data can provide a more direct connection between business activity and emissions.
Level 2: Move from money to physical activity
Once companies identify their most important Scope 3 sources, the next step is often to replace financial proxies with physical activity data.
Instead of asking “How much did we spend?” we ask “What did we actually purchase, transport, consume, or generate?”
Activity data can include:
- kilograms of material purchased,
- litres of fuel consumed,
- kilometres travelled,
- passenger-kilometres,
- tonne-kilometres transported,
- kilograms of waste generated,
- hotel nights,
- cubic metres of material,
- or units of a particular product.
The basic principle becomes:
Physical activity × Relevant emission factor = Emissions
For example, instead of calculating the emissions associated with aluminium using:
The company might calculate:
The calculation is now more directly connected to what the company actually purchased or did.
Activity data across Scope 3
Physical activity data can take different forms depending on the Scope 3 category.
- Purchased materials
- kg material × kgCO₂e/kg
- Transportation
- tonnes transported × distance × kgCO₂e/tonne-km
- Business travel
- passenger-km × kgCO₂e/passenger-km
- Waste
- kg waste × kgCO₂e/kg for the relevant treatment method
- Fuel- and energy-related activities
- kWh or litres consumed × relevant upstream emission factor
The important change is that the calculation is increasingly connected to the actual activity taking place.
If a company reduces material consumption by 20%, for example, that reduction can be reflected directly in the activity data.
Level 3: Introduce supplier-specific information
Industry-average emission factors are useful, but two suppliers producing the same material can have very different carbon footprints.
Their emissions may depend on:
- electricity sources,
- fuels used,
- manufacturing technology,
- recycled content,
- production efficiency,
- sourcing of raw materials,
- logistics,
- and other factors.
This is where supplier-specific data becomes valuable.
Instead of using an industry-average emission factor such as:
The company may eventually use:
If the supplier provides a credible product carbon footprint or other appropriate cradle-to-gate emissions data, the calculation can better represent the particular product being purchased.
This becomes particularly useful when companies want to move beyond measuring emissions and start influencing them.
For example, procurement teams can begin comparing:
- different materials,
- production technologies,
- recycled versus virgin inputs,
- supplier decarbonisation progress,
- and lower-carbon sourcing options.
Scope 3 data can then become part of actual purchasing decisions rather than simply an annual reporting exercise.
The reality: you will probably use a hybrid approach
Moving from spend-based estimates to supplier-specific emissions rarely happens overnight.
A company might have excellent primary data for its ten largest suppliers while still relying on secondary data for hundreds of smaller ones.
That is normal.
For example, a company could have:
- Supplier A
- Product carbon footprint
- Supplier B
- Supplier-specific energy and material data
- Supplier C
- Physical quantity × industry-average emission factor
- Supplier D
- Spend × EEIO emission factor
All four suppliers can still form part of the same Scope 3 inventory.
The important thing is to document which methodology and data source were used.
This leads to an important principle:
Scope 3 data maturity is not all or nothing.
You do not have to choose between “We only have estimates” and “Every supplier has provided a verified product carbon footprint.”
There are many useful levels in between.
More supplier-specific does not automatically mean more accurate
There is another important distinction.
More supplier-specific data is not automatically better data.
A poorly calculated supplier carbon footprint may be less reliable than a high-quality secondary dataset.
Companies should therefore consider more than simply whether data came from a supplier.
Important questions include:
- What boundary was used?
- Which emission factors were applied?
- What reporting period does the data represent?
- How was the footprint allocated between products?
- Does it include all relevant cradle-to-gate emissions?
- Is the methodology documented?
- Has the calculation been independently reviewed or verified?
- Is the data geographically and technologically representative?
The objective should therefore be to increase both data specificity and data quality.
Don't improve every datapoint at the same time
One of the biggest mistakes companies can make is trying to obtain perfect data for every Scope 3 activity immediately.
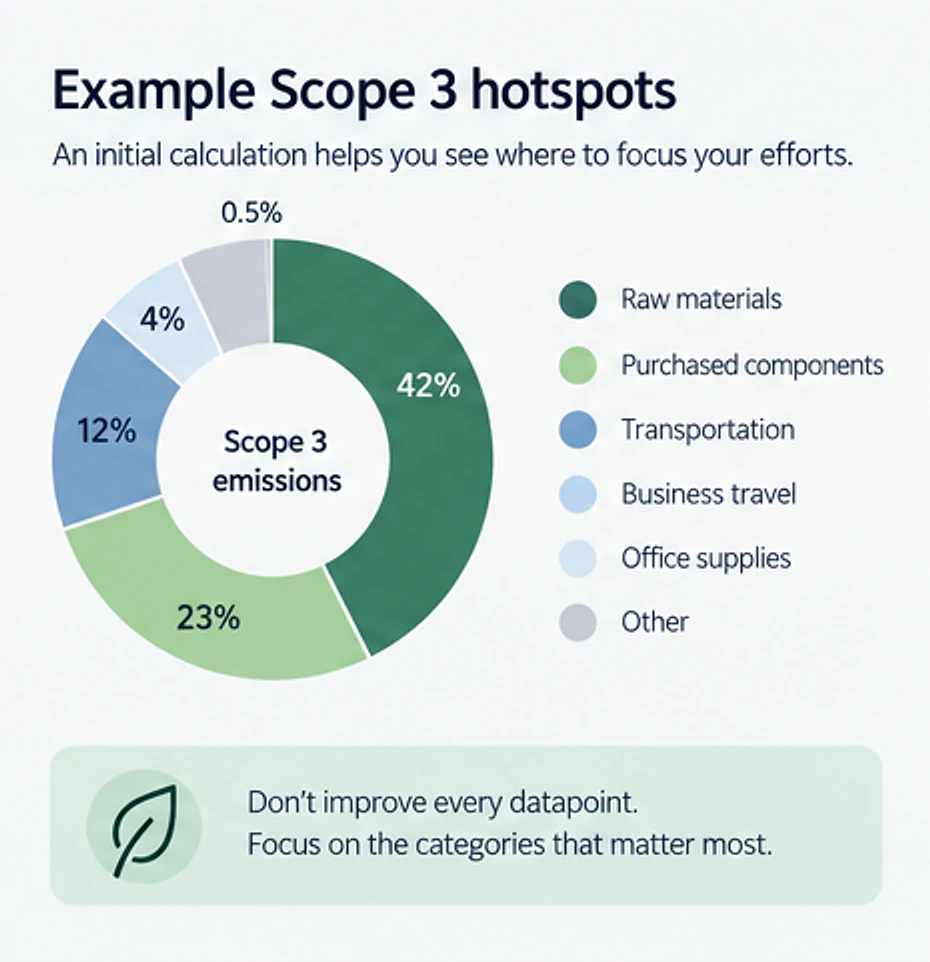
Imagine an initial Scope 3 screening shows:
| Source | Share of estimated Scope 3 emissions |
|---|---|
| Raw materials | 42% |
| Purchased components | 23% |
| Transportation | 12% |
| Business travel | 4% |
| Office supplies | 0.5% |
Where should the company focus its data-improvement efforts?
Probably not on office supplies.
The first calculation should help determine where better information could materially improve the inventory or support better decisions.
The process can therefore be:
- Calculate — Create an initial Scope 3 inventory using available data.
- Identify hotspots — Find the categories, materials, suppliers, products, and activities contributing most to emissions.
- Prioritise — Determine where improved data would have the greatest value.
- Collect better data — Replace spend data with quantities, improve emission factors, and engage important suppliers.
- Recalculate — Update the inventory as better information becomes available.
- Repeat — Scope 3 data quality should improve over time.
A practical Scope 3 data maturity journey
The progression can be summarised simply:
| Stage | Example | Typical data source |
|---|---|---|
| Spend-based | € × kgCO₂e/€ | Accounting data, invoices and procurement exports |
| Physical activity data | kg material × kgCO₂e/kg | Purchasing, ERP, logistics or operational systems |
| Hybrid | Supplier data + secondary data | Suppliers + internal systems + emission factor databases |
| Supplier-specific | Purchased quantity × supplier/product-specific footprint | Supplier PCFs or primary emissions data |
This should not be seen as a rigid ladder where every single Scope 3 datapoint must eventually reach the final stage.
The appropriate level of detail depends on:
- materiality,
- availability of information,
- intended use of the inventory,
- quality of available datasets,
- and the company's ability to influence the emission source.
For some small emission sources, secondary data may continue to be perfectly appropriate.
For major materials, suppliers, or purchasing categories, investing in more specific data can provide significantly more useful information.
Better Scope 3 data enables better decarbonisation decisions
Improving Scope 3 data should not be an objective by itself.
The real question is: What can we do with better data?
With spend-based estimates, a company may discover that purchased materials are its largest Scope 3 source.
With physical activity data, it may discover that two particular materials dominate the footprint.
With supplier-specific data, it may discover that the same material has very different emissions depending on the supplier or production route.
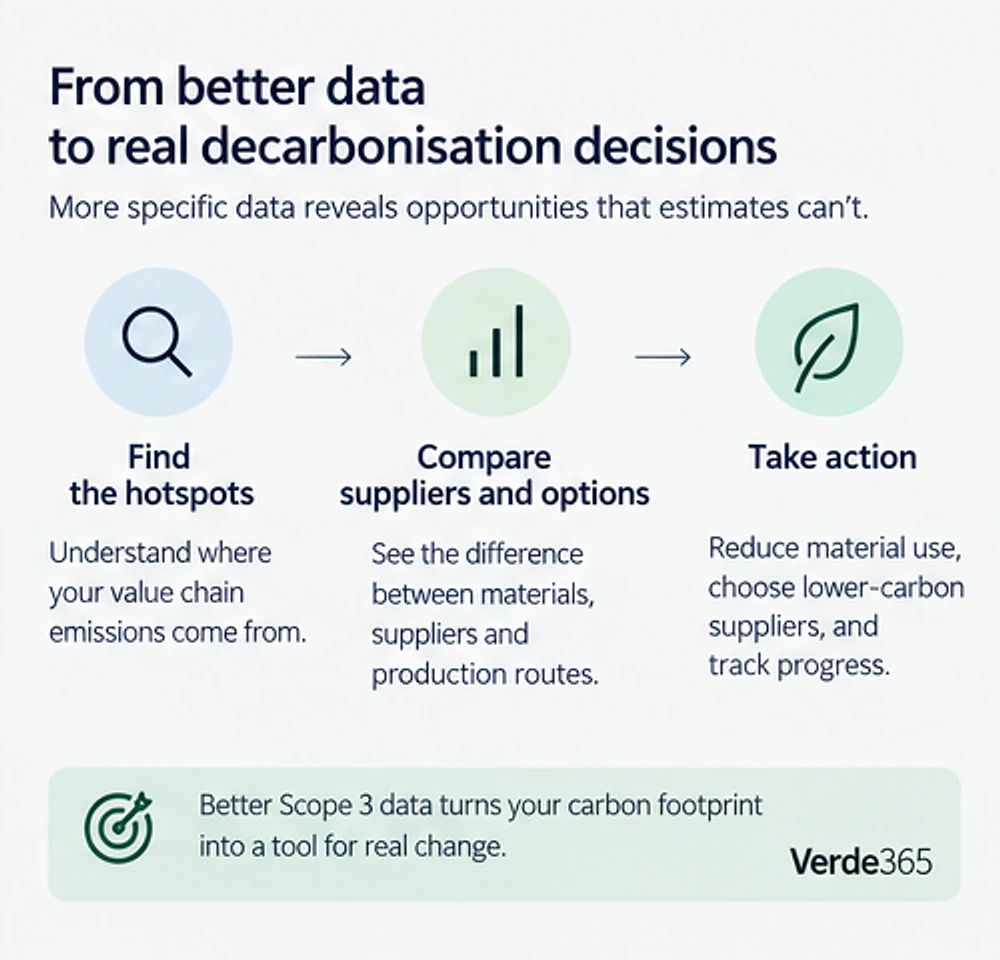
That information can support actions such as:
- reducing material use,
- increasing recycled content,
- redesigning products,
- selecting lower-carbon materials,
- optimising transportation,
- engaging suppliers,
- incorporating carbon into procurement criteria,
- or working with suppliers on emission reductions.
The calculation becomes more than a reporting number.
It becomes a decision-making tool.
Start first. Improve over time.
Scope 3 accounting does not have to begin with perfect supplier data.
For many organisations, the most practical approach is to start with what is already available.
Your accounting data can already be enough to get started.
Invoices exported from accounting software can provide the financial information needed for spend-based estimates.
Procurement and operational systems can then provide physical activity data.
Emission factor databases can improve the connection between activity and emissions.
And supplier engagement can gradually introduce more product- and supplier-specific information.
The important thing is not to wait.
A useful Scope 3 inventory can evolve:
And the process does not stop once the first footprint is calculated.
Each reporting cycle provides an opportunity to identify the most important gaps, improve the underlying data, and make the inventory more useful for actual decarbonisation.
How Verde365 can help
Verde365 enables companies to begin calculating Scope 1, Scope 2 and Scope 3 emissions using the data they already have.
For Scope 3, getting started can be as simple as exporting invoices from your accounting software and uploading them to Verde365.
Using EEIO emission factors, Verde365 can turn purchasing data into spend-based Scope 3 estimates in seconds, giving companies an initial view of their value-chain emissions without waiting for detailed information from every supplier.
From there, companies can progressively replace estimates with:
- physical activity data,
- more representative emission factors,
- supplier-specific information,
- and product carbon footprints.
This creates a practical path from an initial screening to increasingly specific Scope 3 calculations:
Because better carbon accounting is not about having every answer on day one. It is about starting with the data you already have and building a better picture with every reporting cycle.
Ready to start with the data you already have?
Upload your invoices, get an initial spend-based Scope 3 footprint in seconds, and improve it with activity and supplier data over time with Verde365.